
by Jeffrey Reichenberg
August, 1997
Ą Abstract
This project is undertaken as an experiment in providing computer generated visualization support for the urban design process. Working under the umbrella of the Seattle Design Commission's Pike Street Improvement Project, a computer model was used in the design conceptualization of a streetscape improvement scheme. Output from the computer model includes a real-time simulation experience in which participants explored the model on computer screen, printed views, a plan view and a videotaped "walkthrough".
The process of using computer visualization technology in an urban design setting is both methodologically and technically complex. Methodologically, adequate thought must be given to creating accurate images of existing or proposed conditions and presenting them in an accessible and fair manner. As with all methods of visual representation, the goals of providing accurate content and accessible output are complicated by the limitations of the technology used to create and present them. This project explores the interplay between these methodological and technical issues.
Table of Contents
List of Tables
List of Tables
1. Seattle Design Commission Project Timeline
2. Concepts shown in the revised model
3. Concepts omitted from the revised model
List of Figures
5. Existing and concept conditions at 2nd Avenue
6. Existing and concept conditions at 7th Avenue
Acknowledgments
The author wishes to thank Professors Dennis Ryan and Anne Vernez Moudon for their assistance with this project and report. In addition, thanks to Marcia Wagoner of the Seattle Design Commission for her enthusiasm in supporting an experimental project. Sincere thanks also to James Davidson and Brian Johnson for both conceptual and technical assistance.
I. Introduction
This Professional Project is undertaken as an experiment in providing computer generated visualization support for the urban design process. Although the use of computer visualization technology for urban design is still in its formative stages, the technology to support such visualization is already largely in place. One can safely anticipate that, as the technology is developed further, use of computer generated visualization tools in urban design and planning will become increasingly widespread. It is therefore important to develop a vocabulary and methodology for providing such computer generated output in an effective way.
The process of using computer visualization technology in an urban design setting is both methodologically and technically complex. Methodologically, adequate thought must be given to creating accurate images of existing or proposed conditions and presenting them in an accessible and fair manner. As with all methods of visual representation, the goals of providing accurate content and accessible output are complicated by the limitations of the technology used to create and present them.
The output generated in this project is geared toward providing visualization tools which are easy to understand. We are attuned to navigate the world in 3-dimensions using perspective and movement as cues to guide our interactions. Unfortunately, most traditional visualization tools are two dimensional. Even drawings that use perspective to draw the viewer into the scene are somewhat "flat" because of their limited field of view and static quality. A 3-Dimensional visualization tool provides the opportunity to view design concepts using more of our natural, perceptual capabilities. Specifically, output from this project includes: 1) a 3D computer model which can be manipulated and navigated on screen, 2) printed views from the model as a design sketchbook, 3) a plan view of the project area and 4) a video "walkthrough" of a revised model showing design concepts.
As with any work product, the background of the author should be considered as the work is reviewed. My interest in computer graphics developed only recently, in my second year of graduate school in Urban Design and Planning. In the course of a year, I've developed my technical skills to a point where I can now use computer graphics as a tool in other work. That said, I do not consider myself a "computer person." Rather, I seek to use computer graphics to further my interest in Planning.
This report is divided into five sections. Project Background examines the Pike Street Improvement Project and the goals of the computer visualization. Execution introduces the content and output of the computer model and describes key project management issues. Interaction discusses the process by which the computer model was used as a design tool. Finally, Evaluation and Conclusions gives a wrap-up of the project in the context of the project goals. Appendices including a technical explanation of the creation of the computer model, sample output from the model and surveys of Design Session participants regarding the effectiveness of the project are provided following the text.
back to Table of Contents
II. Project Background
A. The Seattle Design Commission and The Pike Street Improvement Project
The client agency for this Professional Project is the Seattle Design Commission, an agency of the City of Seattle. The Design Commission is charged with facilitating conceptualization and review of all City-funded urban design and development projects. The Commission is composed of seven volunteer design professionals and supported by a paid staff of four.
The Pike Street Improvement Project is an effort by the City of Seattle to improve streetscape amenities along the downtown portion of Pike Street (see locator map, figure 1). Pike is an arterial street running from Pike Place Market in Downtown Seattle, over the I-5 freeway and on to Capitol Hill. The Pike Street Improvement Project is concerned with streetscape improvements to the 9 blocks from the Market to the I-5 freeway. Traffic runs one-way eastbound in the project area. Bounded by the Pike Place Market and the Washington State Convention and Trade Center, the project area is a retail and entertainment center with a major hotel, movie theater and numerous national and local shops and restaurants. Seed money of $200,000 in City funds has been allocated for the Pike Street Project, although more money may become available as the project proceeds into implementation.1
The streetscape improvement project is a direct outgrowth of a similar project to improve Pine Street, one block to the North. The Pine Street project was completed in 1996 with a $1 million federal grant and City funds and includes upgraded street lighting, bus shelter improvements, resurfacing of sidewalks and other streetscape modifications. One of the implicit goals of the Pike Street project is to implement a similar program to the
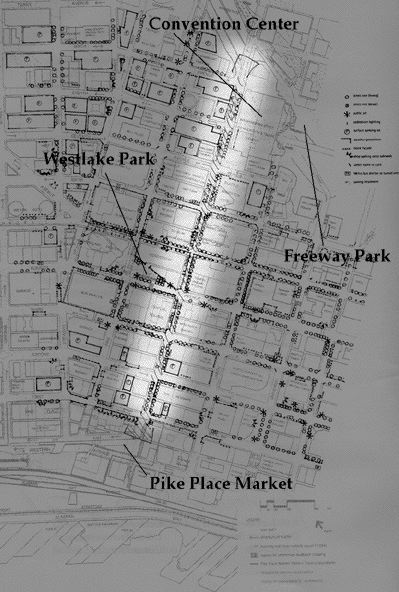
Figure 1 Ą Project Area
Pine Street improvements and thus create a unified urban design along Pike and Pine in the downtown. Other factors which brought about the Pike Street Project are perceived and real crime problems at the Western end of the project area and a major planned expansion of the existing Convention Center over the street at the Eastern end.
To execute its charge of facilitating design conceptualization for this project, the Design Commission chose a two-workshop format. The first workshop was an open-house at which area business owners and other stakeholders were introduced to the project and asked for initial input. The second workshop was an all-day Design Session where 22 invited stakeholders and design professionals conceptualized actual street improvement schemes. Following the two workshops, a public presentation of concepts from the Design Session was made to generate additional comments before implementation. Table 1 below shows the timeline for the project and indicates the steps at which the 3D computer model of the street was used:
Table 1 Ą Seattle Design Commission project timeline, Pike Street Improvement Project:
| Action | Date | Description | Computer Model Use |
|---|---|---|---|
| 1. Open House / Information Session | May 14 | Public meeting and open house to discuss ideas and concerns regarding Pike Street and streetscape improvements | none |
| 2. Design Session | June 11 | All-day programming and Design Session with 22 invited stakeholders and design professionals | Real-time computer simulations of the street available on desktop computer. Printed images from the model also available |
| 3. Prioritization and reporting back | August | Public presentation of prioritized streetscape design concepts as proposed during the June 11 Design Session | Videotaped "walkthrough" of updated computer simulation showing design concepts |
| 4. Implementation | Fall/Winter | Design concepts are implemented using $200,000 allocated funds. Additional concepts from this project are implemented as additional funding becomes available | none |
B. Purposes of the Computer Generated Visualization Component
The purpose of this project was to provide, via output from a computer model of the project area, visualization support for the design conceptualization stages of the Pike Street Improvement Project. The visualization aids produced for this project, commonly referred to as "simulations" or "virtual reality", are intended to recreate, or simulate, the project area and allow modification as design concepts are developed. As shown in the table above, the computer simulations were primarily intended for use in the design development session (i.e. the second of the two planned workshops) and as a follow-up presentation of the concepts developed during that session. Both the client and I agreed that these simulations were to act as an experimental supplement to more traditional visualization aids. I was therefore given considerable leeway in determining their scope and format.
The process of urban design has always relied on some form of simulation. As Peter Bösselmann describes in his book Representation of Places: Reality and Realism in City Design, visual representation for urban design comes in two fairly distinct flavors: perceptual and conceptual (Bösselmann, 1997). Perceptual visualization aids are those which represent reality as we see it, generally via perspective drawings. Conceptual representations such as a plan view or map, on the other hand, attempt to provide a more analytically robust tool by abstracting reality in order to distinguish certain spatial relationships. In exploring their pros and cons, Bösselmann sets up a tension between these two methods of representation and suggests that a new form of representation is needed to bridge the gap.2 Perceptual representation, he states, does not provide us with hard facts about a space but rather relies on our ability to understand spatial relationships via sensory experience. Conceptual representation in the form of a plan or orthographic overhead view provides no sensory experience but abstracts spatial relationships so that they may be better understood. Both methods are somewhat limited in their usefulness and are user specific in that designers and non-designers differ in their understanding of them.
This issue of understanding is key. We must be able to understand how our environment, or proposed environment, fits together visually. Perceptual tools, e.g. architectural sketches, go some distance toward providing this understanding but are static and too limited in their field of view to provide clues as to spatial relationships. Conceptual tools, e.g. maps, give us spatial relationships but are difficult to translate into what we ultimately want to know -- what will this design look like? Throughout his book, Bösselmann explores the need to unify or balance these two basic methods of visualization.
Ultimately, we need both types of tools or, ideally, a new tool with both perceptual and conceptual qualities. The visualization experiment undertaken in this project attempts to find this balance by providing designers and stakeholders with visualization tools which are more perceptually and conceptually versatile than what they would otherwise use. Specifically, 3D computer graphics are used to show basically perceptual information while giving the viewer freedom to explore the underlying spatial relationships of any particular view. In this sense, the intention of the project is not to simply provide an additional visualization aid but rather to present a fusion of the visualization aids already available.
With this in mind, my task was to provide several forms of output from a single 3D computer model for use during the design development session. The output, discussed in greater detail in sections III and IV, includes printed wireframe and color perspective views, a 2D printed plan view, real-time simulation of the project area via desktop computer and a videotaped "walkthrough." The goal of providing varied forms of output was not only to examine their relative usefulness in filling the need Bösselmann sets up, but also to explore the efficiency of using a single 3D computer model to provide an entire suite of visualization tools.
back to Table of Contents
III. Execution
A. Issues
A visual simulation or representation created on computer is commonly referred as "virtual reality." Despite the use of the word "reality", it is important to note when considering a "virtual reality" simulation that it is not an objective representation. Technical and methodological limitations always force some degree of abstraction -- the method by which this abstraction is accomplished is subjective. Even as technology advances, reality is too complex and experience-based to objectively recreate in a computer simulation. That said, computer simulations can still be useful in urban design by providing a more versatile suite of tools than traditional maps and perspective drawings.
The reconstruction of a proposed or existing physical space in virtual space is complex not only technically, but also methodologically. The technical component, the act of actually building the space in a computer and displaying it realistically, requires a fair degree of knowledge and experience with varied software, hardware and output devices and access to suitable computer equipment. The methodological component -- deciding what portions of the physical space to include in the model, how these components should be represented and how this representation will be presented to the viewer -- requires that the 3D designer have a firm grasp of how those using the simulation will understand the images presented.
The technical side of the problem is the easier to conceptualize. A virtual environment can be thought of as a large database which the computer translates into visual (and sometimes aural, olfactory and tactile) output. The visual database consists primarily of sets of 3D coordinate (x,y,z) points which make up the basic primitive shapes of the environment. These primitives (commonly triangles) are assigned color and texture properties and combined to make accurate representations of the complex shapes present in the real-world. Figure 2 shows a view from the Pike Street model as both pure geometry and in its final "textured" form.
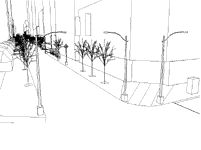
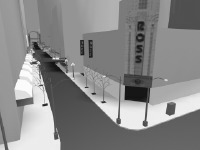
Figure 2 Ą view East from 3rd Avenue as wireframe geometry (left) and textured output (right)
The computational limitations of present computer systems require that some measures of economy be taken when building and viewing (or "experiencing") the virtual world. The inclusion of photo-realistic effects, organic shapes (such as trees and people), sound and smells in an interactive environment weigh heavy on computational power and are only now becoming technically feasible. Still, as evidenced in the Pike Street model, present technology allows the creation and output of fairly realistic abstractions. The creation of more and more realistic virtual environments will certainly be possible as computer technology advances.
The methodological issues surrounding virtual environments for urban design are more complex. While the goal of a virtual environment might be to replicate reality, it is ultimately only a representation and is therefore somewhat subjective. It is certainly not reality simply transferred to the computer but rather, as Bösselmann notes, is the product of the virtual environment builder's own vision and experience.3 Further, technical and time considerations force choices about what to include in the environment and at what level of detail. If proposed development is shown in the environment, thought must be given as to how it is shown in relationship to existing conditions. Even the method by which the virtual environment is viewed or experienced is a source of subjective influence. Virtual reality, then, is never an objective view of reality.
The goal of realism in a simulation makes these methodological considerations particularly important. The more realistic the simulation is, the more we tend to forget about the subjective influences involved in its creation. This is much more of an issue with creating virtual environments than other forms of representation such as architectural sketches, physical models or even architectural photography. These more traditional modes of representation provide the viewer with many more clues as to their subjective nature -- style, scale and limited peripheral scope all serve to alert the viewer that s/he is viewing a representation of reality and therefore must take into account why that representation has been made in such a way. The immersive and "hard-lined" nature of virtual environments tend to obscure these cues and make the representation seem much more objective than it really is. Further, technological limitations and the fact that most people are not comfortable with the idea of navigating in a virtual environment necessitates a reliance on either video-taped output or the use of a "driver" to navigate the real-time simulation. By definition, this "driver" subtly influences what people will see in the representation.
This issue of perception and understanding is particularly noteworthy. It comes down to a question of access -- a visualization aid is only accessible to those who understand its vocabulary. Traditional visualization aids such as maps and plan views are somewhat limited in their potential audience because a lot of people simply don't understand how the plan view translates to reality on the ground. Bösselmann is again helpful in aiding our understanding of this issue of access. In categorizing traditional visualization tools as either perceptual or conceptual, he implicitly creates a hierarchy of these tools -- designers use both tools while non-designers understand only the perceptual. Part of the appeal of computer aided simulation is that it provides a decidedly perceptual tool which, by virtue of its potential for interactivity, is more robust than a stationary perspective drawing or photograph.
B. The Model -- Content and Output
The implementation process of the Pike Street Virtual Reality project can be broken down into two concerns: the content of the simulation model and the modes of its presentation or output. It is important to remember that, as with all representations, "content" and "output" are not simply two phases in the same project. Rather they are intimately connected and inform one another throughout the process. In other words, it is impossible to first construct the content and then present it -- the chosen modes of output drive the content and vice-versa. Content and output are further connected in that they are both driven by the technical and methodological considerations (which are themselves intertwined) discussed in the previous section.
Content
Initial meetings with the client revealed that all existing streetscape elements in the project area must be represented in the model. It was also determined fairly early-on that the model would consist solely of visual and spatial information -- the inclusion of other sensory or attribute data (e.g. audio simulation or a visual representation of traffic flows) would have required a lot of human and computer resources while not significantly furthering the purpose of the model as a visualization aid.
Despite the conceptual nature of the Pike Street Improvement Project, the accuracy of the simulation is important. To this end, GIS data and engineering maps showing parcels, street and sidewalk widths, and building heights were examined and a complete photo inventory of the project area was completed before the simulation model was constructed. The actual construction of the model, detailed in the Appendix 1, focused on recreating the project area accurate to the nearest foot.
The representation of proposed development in the model proved to be a major content issue. The Pike Street project-area includes by two major proposed projects, an expansion to the existing Convention Center at the Eastern end of the project area and a new main public library building at the Western end. The Convention Center expansion, in final design review at the time of the Pike Street Improvement Project, encompasses two full blocks on the North side of Pike and includes two substantial bridges and a glass barrel-vault structure over the street. The library proposal, still in the siting phase, would place a six-story terraced structure on the North side of Pike between 1st and 2nd Avenues. How should these two developments, in different stages of design and in very sensitive sites, be represented in the model?
The Convention Center expansion proved to be the more troublesome of the two projects to represent. Significant design development and review work had been done at the time the model was constructed and I was provided with detailed drawings of its proposed form. The Design Commission and other City staff voiced concerns over including too much detail of the proposed expansion design in the model for fear of turning the Pike Street Improvement Project into a debate about the expansion design. This view fit with the technical limitations of providing much facade detail in the computer model. I set out to represent the proposed expansion in massing as I had with the existing buildings in the project area. This proved problematic -- the proposed expansion was simply too massive to show only in massing without giving the impression that it would crowd the street. It was decided that some effort should be taken to "lighten" the appearance of the expansion.4 Adding facade detail to the model was not an option -- it would have sapped too much computational power and added an unwanted focus on the actual expansion design. In the end, the problem was handled by rendering the expansion in a light color and with semi-transparent surface properties. The mass of the expansion was further de-emphasized by "cutting" doorways into the facade a street-level. Although imperfect, this solution was found to provide an adequate format to represent the new structure with both computational efficiency and aesthetic fairness.
The library proposal, equally controversial in terms of site if not design, was handled in a similar fashion. Since only conceptual design work had been completed, the actual representation of a library on the site was problematic. A physical model of the proposal constructed by the City, showing the conceptual massing was examined and recreated as faithfully as possible. The building was rendered with semi-transparent surface properties similar to the Convention Center expansion.
The ethical issues of representing proposed development are significant. As stated previously, the issue is not one of objective representation -- there is no such thing. It is rather a question of fairness. Given the technical limitations of representing reality -- not only in computer modeling but in also more traditional forms -- we must examine the implications of our choices of abstraction. It is interesting to note that a possible solution to a problem of abstraction, such as the crowding effect created when the Convention Center expansion is shown only in massing, may be to abstract the representation further. In other words, strive for unreality in an effort to cue the viewer to recognize that s/he is, in fact, viewing an abstraction.
Playing with reality to make the model look good, however, is not always desirable. One of the advantages of a computer model is that certain information can be input or output very precisely. View heights or building sizes, for example, can be set or computed to the milli-inch. To disrupt this precision because the model doesn't quite look right on the output device can make for a sticky situation should the model be scrutinized in ways the creator did not intend. A simulation prepared for an Environmental Impact Statement is an example where it may be important to be precise even if the representation doesn't look quite right.
Output
Output options from the model were also considered during the early stages of the project. The main form of output was to be a simulation that could be experienced in "real-time" at the Design Session. A real-time simulation uses a computer to compute and display a series of still perspective images based on user commands. The images are displayed in fast succession (15 to 30 frames per second) allowing viewers to interactively navigate the environment and seek out any view at-will. Real-time simulation is similar to animation in that it provides the user with the effect of moving through the model but also provides the additional benefit of allowing users to explore the environment on their own, without being constrained to a pre-set motion path. By allowing freedom of motion and perspective, real-time output provides the opportunity to engage the simulation as both a perceptual and conceptual tool.
Further thought about output yielded three other products to supplement the real-time interaction: 1) printed color stills with corresponding wireframe plots of key areas of the model for sketching underlays, 2) an accurate plan view produced by plotting an orthographic overhead view of the model and, 3) a video walkthrough of the design concepts developed in the project. All of these forms of output influenced the content of the model and yielded unique technical and methodological issues.
- Output -- Real-time simulation
While extremely useful, real-time simulation is also computationally expensive. In order to simulate the model in real-time at the design event, an appropriate balance had to be struck between the speed of the computer and the complexity or content of the model. In the original conception of the project, the client was to provide a fairly fast (160Mhz or so) Pentium desktop computer on which to run the real-time simulation at the design event. With the speed of the output computer more or less fixed (it ended up changing but only after the model was built), complexity considerations influenced the content of the model.A quick primer on real-time simulation techniques is worth-while at this point. A virtual-reality simulation can be thought of in terms of two components: geometry and texture. Since computational speed is a limiting factor, the complexity which these components add to the model must be understood and measures of each must be taken during construction of a virtual environment. Geometry is the database of coordinate sets which the computer uses to construct surfaces. Geometry is generally measured in terms of number of polygons (i.e. number of triangular primitives). Texture is the appearance characteristics of those surfaces. While these appearance characteristics can be defined as a simple solid color, which costs relatively little computationally, it is common to "color" a surface with an image file called a texture map -- commonly a scanned photograph of a real surface. Texture maps are very computationally expensive and are measured in terms of the number of megabytes of the image files. An example of texture mapping in the Pike Street model is the "Ross" building facade shown in figure 2. For the Pentium desktop computer considered for output in this case, a practical limit of about 6000 polygons of geometry and about 4 megabytes of texture mapping would have to be adhered to for the model to run even somewhat smoothly in real-time.
In order to achieve the most realistic effects for an architectural model such as Pike Street, the street would be built in massing and texture maps of each building facade, similar to the "Ross" storefront, would be applied to give detail. However, most of the available computational "room" in the model was already committed to simulating the streetscape elements as realistically as possible. For example, numerous (approximately 100) street-trees and round-globe pedestrian lamps in the project-area are particularly computationally expensive, containing approximately 75 polygons each. With all of the streetscape elements in place and the buildings constructed in massing, the model contained approximately 40,000 polygons. Needless to say, the model was already well above the practical limits of the output device. I was therefore forced to either abandon the idea of texture mapping the building facades or seriously simplify the streetscape elements in order to make computational "room." This question of computational complexity is a clear example of how the content of the model is influenced by the output and, more importantly, how the method of representation is affected by the limitations of technology.
Since the goal of the project is to assist designers in visualizing existing and concept streetscape elements as completely as possible, it was decided that these elements should not be simplified to make room for texture mapping building facades. However, the lack of texture mapping was found to cause orientation problems when the model was viewed in test runs -- it is difficult to figure out where you "are" on the street without familiar building facades to use as a visual reference. The orientation problem was functionally (if not necessarily artistically) mitigated by including several small texture maps showing familiar retail signs along the street. The inclusion of the signs (approximately 4 per block) allowed persons familiar with the street to associate the buildings shown in massing in the model with the real buildings they represent.
This not only assisted in orientation, but also served as a way to suggest a more complete image of the building forms than is actually present in the model to those who could mentally fill-in the missing information through their own experiences of the street. From the technical perspective, using signs as the only texture mapping is relatively efficient in that each one takes a minimal amount of computational power. Further, the omission of texture mapped building facades reduced the visual noise of the real street, distilling the visual information of the project area to its component parts -- sidewalks, trees, lamps, etc.
- Output -- Printed views
The printed color and wireframe views were used as a sketchbook companion to the real-time simulation during the Design Session. A total of 18 views were produced as both color prints from the finished model and wireframe plots with the "skin" of the surfaces removed. These views, included as Appendix 2, were arranged in pairs on 11 x 17 sheets and presented to each participant in the Design Session in the form of a sketchbook. The same view pairs were also mounted on presentation boards to allow for easy reference during the session.The obvious issue to consider when composing such views for presentation is what to show. While the basic idea was to document areas that would likely be targets for the most work on the project, the client gave little other direction about how those areas should be shown. Again, as with any representation, choosing and "photographing" these views brought-up methodological issues.
For example, providing views which give the viewer enough visual cues to identify the specific location of the scene proved difficult. Because the model gives visual cues of location mostly via distinctive signage, I found myself choosing views in which signs made-up a predominant part of the composition. Even so, the choice of views did not seem to be an issue at the Design Session.
In order to further aid in "cueing" the viewer into the scene, I sought to render the views with as wide a field of view as reasonably possible. In most computer renderers, including the one I used, the metaphor for defining views is the placement of a virtual camera in the scene and then adjusting its target point and "lens" length. The lens length adjustment has the same effect of changing lenses on a real camera. Shorter lens lengths give a wide-angle effect -- a wider field of view but, as a byproduct, objects in the scene seem further away from one another and from the viewer. A longer lens length produces a zoom effect, narrowing the field of view and making objects seem closer than they actually are. Using a "normal" lens (i.e. a lens which causes no distance distortion and has a medium field of view -- the equivalent of a 65mm camera lens) is an option, but was found to produce too narrow a field of view to provide enough locational cues. A 30mm lens length was found to be at least an adequate compromise between a wide field of view and minimizing distance distortion.
Another issue considered as the views were composed was the height and angle of the viewpoint itself. Several test views were produced from heights ranging from 6ft off the sidewalk surface with a 15o angle of view (i.e. pedestrian height) to 70ft with a 60o angle of view. Figures 3 and 4 below shows the range of view angles generated from the model.
 ....
....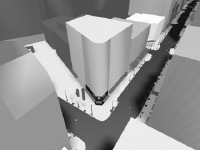
Angles of view for still images. Figure 3 (left) Ą 6 foot camera height, 5 o angle of view. Figure 4 (right) Ą 70 foot camera height, 60o angle of view
Although the higher views seemed to hold the most promise as useful design tools -- mostly because they give the designers more comprehensive vantage points and come close to the traditional axonometrics many of them are used to using -- the pedestrian height views were useful for assessing view-shed issues and the scale of the new Convention Center expansion and library. In light of the fact that both types of views have advantages, it was decided that a variation in view heights and angles would give the best combination of information.
- Output -- Plan view
Although most of my efforts were concentrated on producing an accurate 3-dimensional model, both the client and I knew that, when it came down to actually working at the session, most participants would want to work off an orthographic plan view. Producing an adequate plan view from the 3D model was much more difficult than had been anticipated -- mostly due to content considerations. Simply arranging and plotting an orthographic overhead view of the 3D model is a very simple technical task, but the 3D content of the model was not sufficient for the purposes of the workshop. The model lacked such important planemetric features as traffic lanes and directions, curb-cuts and building entrance locations. In order to produce a useful plan view, a separate 2D version of the model was created and planemetric specific information (i.e. information that could not be represented in the 3D version of the model due to computational power considerations) added to it. The view was plotted at a 1:50 scale for use during the session. - Output -- Video walkthrough
The final form of output is a videotaped walkthrough of a modified version of the model showing the design concepts proposed at the Design Session. Producing the video involved both content and output considerations. On the content side, the concepts from the session had to be faithfully visualized and added to the model. Very few sketches were produced during the session so I was forced to work mostly from verbal descriptions given by the designers during their final presentations. Most of the concepts were fairly straightforward -- widening sidewalks in specific locations, for example. A few were more problematic to visualize, such as "creating a pedestrian friendly environment under the Convention Center expansion canopy." For these more general suggestions, schematic visual cues were added to the model (in the particular case of the area under the Convention Center canopy, information kiosks and sidewalk cafe seating were added). The following table shows the specific concepts that are visualized in the final model:Table 2 Ą Concepts from the Design Session shown in the revised model:
Concept from Design Session Representation Method in Revised Model pedestrian lighting similar to Pine Street 2-globe pedestrian lights, 12 per block widen N sidewalk between 1st and 2nd, add street vendors sidewalk widened 10 feet, 4 kiosks added alley lighting between 1st and 2nd fixtures mounted on alley walls, 4 per side decorative crosswalk paving at 2nd and 3rd Avenues cobble texture map at crosswalks decorative fencing or lattice work around parking lot at 2nd Avenue 4-foot high fence with iron-grill texture map and light fixtures move bus shelters back to building-edge -- redesign as awnings bus shelters removed, awnings mounted on building facades at bus-stop locations gateway arch at 3rd Avenue with Pike Place Market iconography arch with salmon and crab icons rising approximately 30-feet at highest point "path" of clocks leading to the Market existing street clock at 4th Avenue duplicated and placed on 3 corners toward the Market widen sidewalk in front of Seaboard Building (Seafirst Bank) -- add street trees sidewalk widened approximately 10 feet, 2 street trees added widen North sidewalks between 7th and 9th sidewalks widened approximately 15 feet "super-scale" trees (palms or poplars) under WSCTC canopy 5 90-foot tall palms and poplars added under canopy create pedestrian-friendly zone under proposed WSCTC canopy kiosks and sidewalk seating mid-block crossing under WSCTC canopy cobble texture map For a variety of reasons, some of the concepts from the Design Session were not included in the final model. In some cases, the concept was could not be visually represented within the scope of the project. In other cases, the level of detail in the existing model was not compatible with showing the concept. The concepts omitted from the revised model and the reasons for omission are given in the table below:
Table 3 Ą Concepts omitted from the revised model:
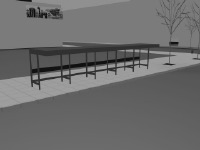
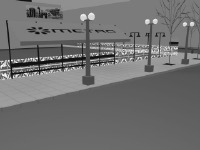
Concept from Design Session Reason for Omitting from Final Model Increase police or other uniformed presence between 1st and 3rd not visual Establish tree maintenance program not visual Patch sidewalk in front of Ross with concrete level-of-detail not compatible with existing model Encourage Sheraton to "open-up" its blank wall level-of-detail not compatible with existing model Improve pedestrian access to Capitol Hill (rework 9th Avenue intersection) level-of-detail not compatible with existing model Build gateway art piece at 9th Avenue level-of-detail not compatible with existing model Encourage historically relevant art level-of-detail not compatible with existing model Allow 1 lane of West-bound traffic to 8th Avenue not visual The representation of the concept ideas caused complications during the production of the walkthrough video. Originally, I was to provide the client only with raw walkthrough footage of the revised model. It became clear, however, that other information was required for the video to be useful. Not only were some of the concepts represented schematically and thus in need of some explanation, but it was also difficult to represent the concepts in such a way as to differentiate them from the existing conditions. To solve these problems, a "before and after" approach was taken using still images from the old and revised models. In the final video, a still shot showing existing conditions fades into "concept" conditions for each of the proposed design concepts. Figure 5 shows two sample images from the video, existing and concept conditions at 2nd Avenue.
Figure 5 Ą existing (left) and concept (right) conditions at 2nd Avenue as presented in the concept video
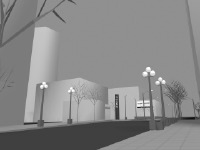
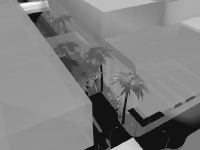
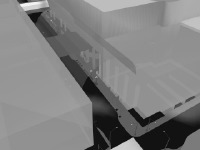
A four-part "before and after" method was used for the scenes showing the Convention Center expansion. As illustrated in Figure 6 below, each scene cycles through (1) existing conditions, (2) existing conditions with the massing of the proposed Convention Center expansion, (3) a palm tree concept from the Design Session and (4) a poplar tree concept.
1. existing conditions at 7th Avenue 2. existing conditions with the massing of the proposed Convention Center expansion
 ...
...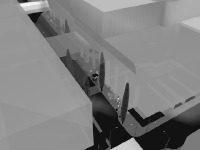
3. palm tree concept 4. poplar tree concept Figure 6 Ą existing and concept conditions at 7th Avenue as presented in the concept videoIn the video, these fade scenes are preceded by text describing the specific concepts. Raw walkthrough footage of the concept model is provided after all the concepts are shown.
 ...
...
 ...
...
C. Project Management
As noted in the introduction, this project was intended as an experimental supplement to the visualization aids which the Design Commission would normally provide. This supplemental status caused some project management problems -- most notably in dealing with the client agency. While my efforts were generally received with an enthusiastic level of support, two specific situations arose which could have been better managed by both parties.
The first situation actually ended up working to our advantage. As mentioned earlier in this report, the client was to provide a desktop Pentium computer on which the real-time simulation could be run during the Design Session. Within a month of the Design Session, it became clear that City regulations would not allow any of their computers to be taken off City property (at this point, the probable location for the Design Session was a meeting room at the Convention Center). Some thought was given to holding the session at the UW so that College of Architecture and Urban Planning computers could be used. This plan was abandoned, however, as some of the invited Design Session participants expressed concern about travel distance to the University. The only option for saving the real-time component of the project was to contact computer manufacturers and vendors to see if a machine could be loaned for the day. Fortunately, Silicon Graphics, Inc., makers of the industry standard hardware and software for real-time simulation, was amenable to loaning a machine in exchange for allowing a marketing display to be present at the Design Session. The computer they provided was, in fact, much more powerful than either the Pentium the client was to provide or the machines at the College of Architecture and Urban Planning. This significant increase in computational power allowed for much smoother operation of the real-time simulation than would have been otherwise possible.
The second project management problem did not work out as favorably. I had planned the presentation assuming that the Design Session participants would act as a single group -- therefore making it easy to set-up the computer running the real-time simulation in a prominent and accessible place. However, the Design Commission split the session participants into two groups -- leaving me the choice of "blessing" one of the groups with the computer simulation or setting it up in the middle of the room where it was somewhat out of the way for both groups. I chose to set it up in the middle of the room, between the two groups.
Although efforts were made to acquaint the Design Session participants with the capabilities of the real-time simulation, it became clear as the day progressed that having the machine out of easy reach decreased its use. Several questions arose throughout the day which, had the simulation been right there at the table, would have been easily resolved using the model. While most of these exchanges revolved around verifying location information, a few more sophisticated queries arose such as, "how will the Convention Center expansion affect the view from Capitol Hill" and "how will sidewalk space open up if we remove the bus shelters at 2nd Avenue." The actual use of the real-time simulation and other tools derived from the 3D model are described in the next section, "Interaction."
back to Table of Contents
IV. Interaction
The project produced a varied set of products, both tangible and intangible. The tangible products are, of course, the model itself and its output discussed in Section III -- real-time simulation, printed perspectives, plan view and concept video. These tangible products are intended to show that, once an initial investment to create a 3D model is made, output can be tailored to meet a variety of needs. In other words, the tangible products are representative of the "suite of tools" available to designers who choose to use 3D graphic technologies. As noted in Table 1, these products were used during the design and "reporting-back" sessions.
Further, since the varied output is derived from a single model, all products show a consistency in level-of-detail, accuracy, and style. While not necessary for a short duration project such as Pike Street, this becomes an important for a long-term design effort where visualization aids may need to be significantly modified over a period of time. Deriving several visualization aids from a single "master" model allows changes to be implemented economically and consistently.
Almost more significant than these tangible products, however, is the process by which they are used. The model serves as a common visual reference and a framework for interaction during the design process. In the concept development stage, the model serves to verify "ground-truth" information and, in the Pike Street case, future development. As concepts are developed, they are integrated into the model to assist designers and the public in visualizing the proposed changes. Once again, the model serves as a common visualization of concepts.
Similar to other visualization aids, there are significant methodological issues involved in producing a computer simulation and associated outputs (as discussed in section III). This is somewhat less true if the main output is to be a real-time simulation. While care must be taken to insure the content is accurate, the level-of-detail is sufficient and that users understand what the model does and does not show, the use of real-time as an output ideally frees the producer of the model from constricting the viewer/user to predefined views. I say "ideally" because, at this point, few people are comfortable using real-time simulation technology themselves. As was the case during the Pike Street project, a "driver" is often required to call-up views as needed. Even this is a step forward, however, as real-time simulation technology often only makes it out of the laboratory setting in the form of a videotaped walkthrough produced by the creator(s) of the model.
As expected, the real-time simulation generated more interest than the other tools derived from the model. In general, session participants were enthusiastic about the ability to view the model in real-time and curious about how they could best use it. A few participants were willing to learn how to navigate in the real-time simulation and spent some time exploring the model on their own. Participants seemed to find the representation of the proposed Convention Center expansion particularly informative. Unfortunately, the level of interest in the real-time simulation seemed to be rooted in curiosity rather than use. Lack of familiarity with the model and with navigation techniques certainly lessened the use of the simulation.
The printed perspective views were used less than expected. Participants generally held their interaction with the printed views to examination of the color prints on the presentation boards. Very little sketching was done in the sketchbooks. This was not the case at a previous effort to integrate computers in the urban design process where computer-generated sketching underlays took center-stage5. The sketchbooks may have been used more had a planned walking tour of the street taken place during the session (the walk was canceled due to rain).
As anticipated, most of the actual concept development work at the Design Session took place on the plan views. Informal interviews with participants revealed no major problems with the content, scale or presentation of the plans.
The final form of simulation output, the video presentation showing concepts developed at the session, has not been shown to the public as of this writing.
back to Table of Contents
V. Evaluation and Conclusions
The evaluation of this project must take into account two factors: 1) was the client served? and, 2) did the project provide opportunity for the personal and professional growth of the student involved?
The degree to which the client was served by the project depends on the client's goals in undertaking it. The Pike Street Project is somewhat unique in that the computer visualization was intended as an experimental supplement to existing visualization methods. In the spirit of experimentation, then, any outcome might be considered a "success" in that it provides information about how simulation technology might be used in future urban design projects. By using the model in two different stages of the urban design process (concept development and "reporting back") and providing several different forms of output, the project achieved this stated client service goal of providing a "test-bed" for the incorporation of new technology.
Surveys distributed at the Design Session provide evidence of success in a higher-level of client service -- the virtual model assisted the designers and stakeholders in formulating concepts for the street. Of the 12 participants present for the afternoon portion of the Design Session (the morning was reserved for stakeholder presentations), 8 responded to the survey (included in Appendix 3). Respondents were asked to rate the relative usefulness of the 3 modes of output provided at the Design Session: real-time simulation, printed perspectives and plan views. Additionally, the survey asked for input regarding improvements that could be made to the simulation model itself.
Although the small sample size limits the conclusions that can be drawn from the surveys, they are nevertheless revealing. The ability to explore the model in real-time at the Design Session itself was certainly seen as the most helpful aspect of the presentation. The wire-frame printed views were also generally noted as very helpful (although as noted in the previous section, few participants were observed actually using them). The item most mentioned as an area where the model or output could be improved was the interface for exploring the model -- the use of an experienced "driver" to manipulate the model was almost without exception noted as a necessity.
The second measure of success, providing an opportunity for the personal and professional growth of the student is more difficult to measure. Perhaps it's advisable to break this category up into technical and methodological growth, similar to the issues involved in the creation and output of the model. Using this scheme, I would have to say that the project was far "meatier" methodologically than technically (although these aspects are inherently interrelated). The project provided an opportunity to explore the idea of creating and using a representation of space via 3D computer graphics. Issues of appropriate content and output of the model were explored. Future attempts by the student to provide computer simulations for urban design will certainly be guided by the experience gained in this project.
Finally, the usefulness of this project is also dependent on its timeliness. As noted in at the beginning of this report, technological advances are making computer generated visualizations easier to produce and output. By providing a basically perceptual tool that is more versatile than the static views provided by architectural sketching or photography, computer simulations It is important to develop a vocabulary and methodology through which we can effectively integrate these technologies into the design development process.
back to Table of Contents
End Notes
- The project is aimed at developing a list of design priorities for the street. This list does not necessarily correspond to the funds currently allocated for implementation but rather is an inventory of ideas to draw from as funding becomes available.
- Bösselmann does not necessarily suggest that current design aids are inadequate. He only proposes that they be better integrated
- Bösselmann points this problem out in the context of representations in general.
- While thought was given to the idea that it would , in fact, crowd the street, this was not my determination to make.
- The project was part of the "Belltown Charrette" held at the University of Washington, College of Architecture and Urban Planning in April, 1997. The computer graphics component was led by Brian R. Johnson, Lecturer in Architecture and focused on integrating a wireframe model of the project area into the design process. Surveys of the participants in the Belltown Charrette rank the sketching underlays very highly.
back to Table of Contents
List of Sources
Bösselmann, Peter (1997). Representation of Places: Reality and Realism in City Design. Berkeley, California: University of California Press.
Johnson, Brian R. (1997). Computer Aided Design in the Belltown Charrette, Seattle, WA. Submitted for Publication, SIGGRAPH, 1997.
Linn, Jeffrey (1997). -- Title Unknown -- Master of Landscape Architecture Thesis in progress. Seattle, WA: University of Washington
Schuur, J. (1994). "Analysis and Design in Computer-Aided Physical Planning," Environment and Planning B: Planning and Design 21(1) (January): 97-108.
Seattle Design Commission (1996). Streetscape: An Urban Design Vision for Seattle's Commercial Core. Seattle, Washington: City of Seattle.
Seattle Design Commission (1996). Report of the Pine Street Task Force. Seattle, Washington: City of Seattle.
Appendix 1 Ą Technical Process
The Pike Street simulation model actually consists of three different models, each one in a different software format. The raw geometry was constructed on a 90 Mhz Pentium in AutoCad release 12, yielding a wireframe model in *.dwg format. Wireframe views and orthographic plan views are printed from this file. Textures and lighting were added in 3D Studio release 3 -- allowing still images of the final visual form to be rendered and printed. In preparation for real-time simulation, the *.3ds file was transferred to an SGI Indy R5000 and translated into Open Inventor (*.iv) format using the "3dsToIv" file translator. The *.iv file was then "cleaned-up" and translated into a Virtual Reality Modeling Language (VRML) 1.0 file using Web Space Author.
The structure of the AutoCad file is important in that it determines what manipulations will be possible as the model proceeds through development. The main issue is "granularity" -- making sure that objects that must be manipulated separately in the later stages of development are distinguished from one another. For example, the computer must be able to recognize that street trees are different from sidewalks -- if they are treated as the same object, it would be impossible to color the trees green and the sidewalks gray. Objects are distinguished from each other by putting each on a different AutoCad layer. The Pike Street AutoCad file contains over 200 layers.
Each layer in the AutoCad file is turned into a distinct "object" in 3D Studio. These objects are colored or assigned texture maps. At this point, the visual form of the model is complete and still renderings made be generated using the "camera" metaphor. It is also at this stage that the first firm assessment of file size is made by counting the number of polygons in the model.
Real-time simulation requires that the 3D Studio file be translated into VRML (*.wrl) format using the file translation utilities "3dsToIv" and "ivToVRML". While newer versions of 3D Studio allow a straight export (similar to a "save as" command) to VRML format, the resulting VRML file must invariably be tweaked in order to achieve the desired presentation. For example, the Pike Street model contains approximately 70 similar pedestrian lamps -- in order to reduce file size, the geometric description of each of these lamps was erased and replaced with a reference to an external file containing the description of the a single lamp. Although tweaking such as this can be done by opening the VRML file in a text editor and changing the raw VRML code, this can be tiresome and confusing for large files. The Silicon Graphics program WebSpace Author (now called "CosmoWorlds") provides a graphical interface which makes massaging the VRML file for final output much easier.
-- end -- back to Table of Contents